 R Visualization - Points() 함수
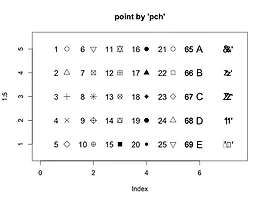
> x x [1] 1 1 1 1 1 2 2 2 2 2 3 3 3 3 3 4 4 4 4 4 5 5 5 5 5> y y [1] 5 4 3 2 1 5 4 3 2 1 5 4 3 2 1 5 4 3 2 1 5 4 3 2 1> pchs plot(1:5, type = "n", xlim = c(0,7.5), ylim=c(0.5,5.5), main = "point by 'pch'")> points(x,y, pch = 1:25, cex=1.5)> text(x-0.4, y, labels = as.character(1:25), cex=1.2)> points(rep(6,5), 5:1, pch = 65:69, cex = 1.5)> text(rep(6,5) -0.4, y, labels = as.character(65:69), cex..
 R Visualization - plot() 함수
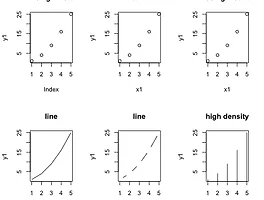
> # X 좌표를 위한 벡터> x1 # Y 좌표를 위한 벡터> y1 # 벡터 생성> z1 # 행렬 생성> (mat1 # 그래픽 윈도우의 화면 분할(2행3열)> op par(mfrow = c(2,3))> # 일변량 그래프> plot(y1, main="using index")> # 이변량 그래프> plot(x=x1, y=y1, main="x^2")> # 이변량 그래프(행렬)> plot(mat1, main="using matrix")> plot(x1, y1, type="l", main="line")> plot(x1, y1, type="c", main="line")> plot(x1, y1, type="h", main="high density")> plot(x1, y1, type="n", main="no plot..